I got the chance to generate correction filters for quite many systems, ranging from desktop to very high end ones.
I thought it could be a good idea to share some objective data as information on how neutral loudspeakers and rooms can be for audio enthusiats.
The data are based on a little bit more than 200 different systems. I have extracted some important features you will see below.
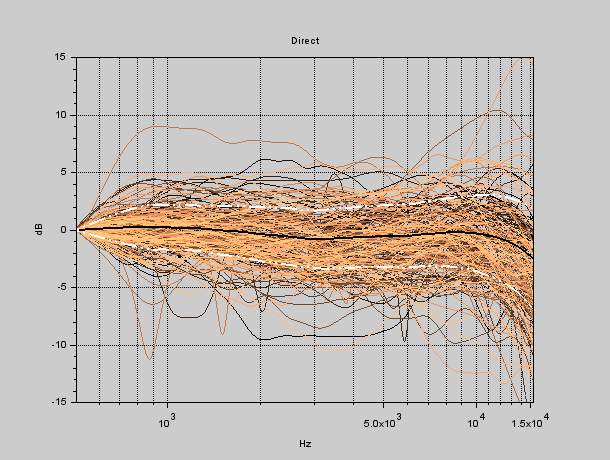
First one is the direct sound from the speakers at listening position. To ease the comparison I have scaled the measurements to get the same level at 500 Hz. The thick black curve is the average from all measurements and the white ones are average +/- one standard deviation. Average is almost flat with a slight touch of "V shape" as quite many speakers do have this "tuning" to stand out in showrooms.
The overall dispersion is quite high with some specimens really out of neutrality.
Next one is the ratio b/w the reverberated sound field and the direct sound : this metric gives a good Indication about speakers overall directivity. For a speaker with good directy behaviour, we expect a smooth declining curve. As before all curves are scaled to match at 500 Hz. The average curve is quite good with a small directivity error in the 2kHz region : this is logical as many speakers have treble crossover directivity error in this frequency range. The dispersion is huge and some speakers have clearly much severe directivity errors.

Looking now at the room itself, I have plotted the "reverberation time" per frequency bands, using an ERB scale (equivalent rectangular bandwith) Even if reverberation time is not a fully appropriate metric for a small room, we can see that the average value is consistent with a non dedicated listening room like a living room.

The system response in the low end is mostly impacted by the room : the first parameter is the level under steady state conditions and the curve below is showing the huge spread (all curves are scaled to the same level at 100Hz) The average value is showing the natural "room gain" which goes up to 5/6 dB. The majority of systems do miss some level below 40Hz and the average is showing two small bumps (like the one at 60 Hz) There is certainly a correlation with ceilings height, the most probable dimension having a recurring pattern among all rooms.

An other room feature is the decay time which has a crucial impact on bass reproduction quality. The variability is again huge and the fluctuations on the average value / standard deviation are showing how difficult it is to avoid any decay issue on the full low range Spectrum.

All of which confirms the value of applying digital correction even for systems/rooms with already decent objective characteristics ;-)